
Abstract
Delivering low-latency, high-throughput wireless communication in the terahertz (THz) frequency range presents challenges for 6G implementation, including signal distortion and destructive interference. To overcome these limitations, we propose a novel approach using multi-antenna beamforming with massive MIMO technology at base-stations (BS) and user equipment (UE). Our centralized optimization mechanism improves spectral efficiency (SE) by clustering UEs within a user-centric cell-free massive MIMO framework. We propose an optimization problem to jointly determine user clustering and BS assignment to maximize total throughput. In this architecture, multi-antenna beamforming at the BSs enables spatially directed transmission and reception, while non-orthogonal multiple access (NOMA) is employed within each cluster to allow multiple UEs to share subcarriers. Uplink signals are resolved using successive interference cancellation (SIC), and downlink precoding leverages estimated uplink channels. This combination ensures efficient resource reuse and robust connectivity even under high user density. Experimental results demonstrate its superiority over existing methods in diverse 6G scenarios, effectively addressing the challenges and requirements of future wireless networks while maintaining computational efficiency.
In this article
Who should connect to whom?
A network works better when users are grouped around their channel conditions. This study jointly models user clustering and base-station assignment, then trains an ensemble of neural networks on optimization-generated decisions to approximate those assignments more efficiently.
In a user-centric cell-free network, many base stations can cooperate to serve users. Choosing which users should share resources, and which base stations should serve each group, creates a coupled allocation problem with interference, connectivity, and pilot constraints.
From the question to the evidence
- Model
Describe a user-centric network
Begin with user and base-station locations, estimated channel coefficients, available subcarriers and pilot limits. Users are grouped for cooperative service instead of being assigned only by fixed cell boundaries. The study assumes a quasi-static or slowly varying channel, TDD reciprocity and the modeled NOMA/SIC setting.
Clustering study, Section II, PDF pp. 3-4; research presentation, PDF pp. 22-24. Read source · PDF page 3 ↗ · Related presentation topic →
- Offline optimization
Create allocation labels
Jointly represent user-to-cluster membership and cluster-to-base-station/subcarrier assignments. The paper replaces products of binary decisions with auxiliary variables and approximates the logarithmic rate term before using CBC to generate allocation labels. The product transformation and rate approximation are different operations; the latter changes the objective being solved.
Clustering study, Section II.B, PDF pp. 5-6, and Section III, PDF p. 7; research presentation, PDF pp. 25-27. Read source · PDF page 5 ↗ · Related presentation topic →
- Supervised data
Pair network features with assignments
Flatten user positions, base-station positions and channel coefficients into input features. Normalize these features and pair them with optimization-generated membership and resource-assignment labels. The two label groups describe different decisions and retain their own indexing structure.
Clustering study, Section IV, PDF p. 8; research presentation, PDF pp. 27-28. Read source · PDF page 8 ↗ · Related presentation topic →
- Ensemble training
Learn the allocation mapping
Train multiple multilayer perceptrons with dense layers, batch normalization and dropout. The described loss combines classification terms with penalties motivated by allocation constraints. These penalties guide learning; they do not by themselves certify that every predicted assignment is feasible.
Clustering study, Sections IV.A-IV.C, PDF p. 8; research presentation, PDF pp. 28-30. Read source · PDF page 8 ↗ · Related presentation topic →
- Inference
Predict a new allocation
For an evaluated network scenario, apply the trained feature transformation, obtain assignment probabilities from the ensemble, average the predictions and round the outputs to binary decisions. The paper evaluates these predictions against optimization-generated labels rather than rerunning the optimization as its online prediction step.
Clustering study, Sections IV.C-IV.E, PDF pp. 8-9; research presentation, PDF pp. 30 and 35. Read source · PDF page 8 ↗ · Related presentation topic →
Architecture and compact method notes
Architecture & information flow
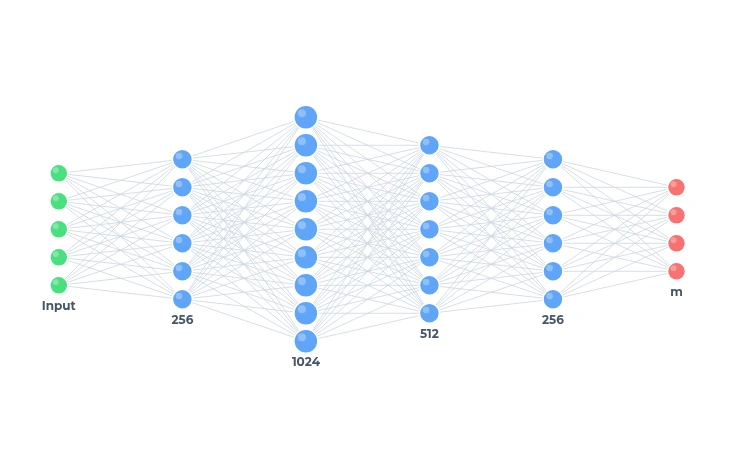
The presentation illustrates an MLP with dense-layer widths 256, 1024, 512 and 256, followed by an output of size m. It identifies user positions, BS positions and flattened channel coefficients as inputs, with ReLU hidden activations, sigmoid outputs, batch normalization and dropout. The output has two semantically different parts: x for cluster-by-user membership and y for cluster-by-BS-by-subcarrier assignment. The publication describes averaging multiple model predictions. No fixed input-feature width, equal x/y split, or ensemble size is asserted here because those details are not consistently established across the supplied artifacts.
Clustering study, Section III.A and Sections IV.B-IV.C, PDF p. 8; research presentation, PDF pp. 28, 30 and 35. Read source · PDF page 8 ↗ · Related presentation topic →
- Describe the networkRepresent users, base stations, subcarriers, and estimated channel coefficients under a quasi-static, low-mobility model.
- Optimize assignmentsFormulate user-cluster membership and base-station/subcarrier assignment together, using a linearized optimization model and allocation constraints.
- Learn from decisionsUse optimization-generated labels to train multilayer perceptrons, with classification loss and penalties derived from the allocation constraints.
- Predict user groupsCombine ensemble predictions to estimate cluster membership and base-station assignments for the evaluated scenarios.
What the study reports
The study reports 110 scenarios of 10 users each, with five base stations and 32 antennas per base station. Evaluation uses optimization-generated targets and a quasi-static channel model; the reported accuracies describe the study test set.
These are results reported by the source publication, not an independent reproduction. Conditions and source disagreements are retained beside the evidence they affect.
The study evaluates user-centric cell-free massive MIMO with modeled NOMA/SIC operation and a short-range, line-of-sight-dominant setting. The cited performance table does not specify an independently verified training/test split.
| Item | Study setting | How to interpret it |
|---|---|---|
| Network scenarios | 110 scenarios, 10 users per scenario | The paper's 1,100 users are distributed across scenarios, not simultaneous users in one network instance. |
| Distributed base stations | 5 | Cooperating base stations in the modeled allocation problem. |
| Antennas per base station | 32 | Multi-antenna reception in each evaluated scenario. |
| Subcarriers | 4 | Resources assigned as part of the clustering model. |
| Maximum pilot length | 10 | A scenario parameter that bounds cluster membership in the formulation. |
| Channel and mobility context | DeepMIMO-based, quasi-static or slowly moving users | Results concern the study's modeled propagation and network assumptions. |
| Learning reference | Optimization-generated assignments | Reported errors measure approximation of these labels; they are not a deployment trial. |
Clustering study, Section II, PDF p. 3; Table I and Section III, PDF p. 6; Sections III-IV, PDF pp. 7-9. Presentation context: PDF pp. 22-24 and 35. Read source · PDF page 3 ↗ · Related presentation topic →
These are source-reported conditions. Conflicting bandwidth values and ensemble counts are not used to construct new measurements or comparisons.
Table II summarizes the study's test-set comparison against optimization-generated targets. Read these values within the 110-scenario evaluation setting; the overall scenario count is not asserted to be the held-out test count.
| Metric | Reported result | Meaning |
|---|---|---|
| Cluster-membership accuracy (X) | 71.00% | Agreement with the optimization-generated user-cluster assignment labels in the reported test evaluation. |
| BS-assignment accuracy (Y) | 79.88% | Agreement with the optimization-generated BS/subcarrier assignment labels in the reported test evaluation. |
| Mean absolute SE error | 0.85 bit/s/Hz | Average absolute difference from the study's reference spectral-efficiency values. |
| Mean squared SE error | 2.91 (bit/s/Hz)^2 | Average squared spectral-efficiency error; its units differ from those of MAE. |
Clustering study, Table II and Section IV.E, PDF p. 9 / journal p. 38. The first three metrics also appear in the research presentation, PDF p. 33. Read source · PDF page 9 ↗ · Related presentation topic →
Reported by the source publication, not independently reproduced or validated here. Classification accuracy and small SE error do not establish feasibility, global optimality, or a universal throughput gain.
Additional reported observations
- Cluster-membership prediction accuracy: 71.00% on the reported test set.
Clustering study, PDF p. 9 / journal p. 38, Table II. Read source · PDF page 9 ↗
- Base-station assignment prediction accuracy: 79.88% on the reported test set.
Clustering study, PDF p. 9 / journal p. 38, Table II. Read source · PDF page 9 ↗
- Mean absolute spectral-efficiency prediction error: 0.85 bit/s/Hz, relative to optimization-generated targets.
Clustering study, PDF p. 9 / journal p. 38, Table II. Read source · PDF page 9 ↗
Inspect the source figures
Read the original presentation visuals with their evaluation conditions. Open a figure to inspect its labels and axes.
Scope & limitations
- The modeled setting assumes stationary or slowly moving users and line-of-sight-dominant, short-range propagation.
- Learning approximates optimization-generated labels; prediction accuracy is not a guarantee of optimality or feasibility for every deployment.
- The supplied paper contains conflicting ensemble counts and bandwidth values. These details are excluded from the public explanation pending clarification.
- The published evaluation does not establish performance in satellite networks or arbitrary high-mobility settings.
Cited in context
Contextual citation in spectrum-demand discussion
A Multi-Dimensional Comprehensive Effectiveness Evaluation Framework and Comparative Validation for LEO Mega-Constellations
The constellation-evaluation paper cites Hejazi and Sabaei when introducing spectrum demand as the spectrum resources needed for a given system capacity. This contextual reference appears in its spectrum-demand indicator discussion, alongside another source.
The citation supports the discussion of spectrum resources. It does not demonstrate that the user-clustering algorithm was executed, adapted, or experimentally validated for satellite constellations, and it does not establish a collaboration or endorsement.
Inspect reference [8] →Method outline
Conceptual pseudocode adapted from the published method and doctoral presentation. It is explanatory, not executable research software or a reproduction. The final validation block is explicitly recommended practice. The source formulation requires clarification before implementation; no disputed constraint equation or rate calculation is reproduced here.
From optimization labels to learned assignments · pseudocode
INPUT  Network scenarios, channel estimates and allocation settings
OUTPUT Predicted user-cluster and BS-subcarrier assignments

REPORTED OFFLINE PIPELINE
  For each modeled network scenario:
    Describe user membership and resource-allocation decisions
    Introduce auxiliary variables for binary decision products
    Approximate the rate objective as described in the study
    Use the allocation solver to obtain supervision labels
    Pair network features with the corresponding assignments
  Normalize input features for supervised learning
  Train an ensemble of MLPs with classification and penalty terms

REPORTED INFERENCE PIPELINE
  Transform the new scenario with the trained feature normalization
  Obtain assignment probabilities from each ensemble member
  Average predictions and decode the two assignment groups
  Round the probabilities into binary candidate assignments

RECOMMENDED VALIDATION BEFORE USE
  Check candidates against an author-reviewed constraint model
  Flag failed checks; do not assume feasibility from rounding
Evaluate on preserved reference labels with explicit metric unitsClustering study, Sections II.B, III and IV, PDF pp. 5-9; research presentation, PDF pp. 25-30 and 35. The validation block is an editorial recommendation rather than a reported algorithmic stage. Read source · PDF page 5 ↗ · Related presentation topic →
Presentation guide and further interpretation
Read the architecture from inputs to decisions
The MLP figure shows how position and channel features become assignment probabilities. The output represents both membership and resource allocation; the figure is an architecture explanation, not evidence that every output satisfies the network constraints.
research presentation, PDF p. 28; Clustering study, Fig. 1 and Section IV. Read source ↗ · Related presentation topic →
Read the throughput CDF as a distribution
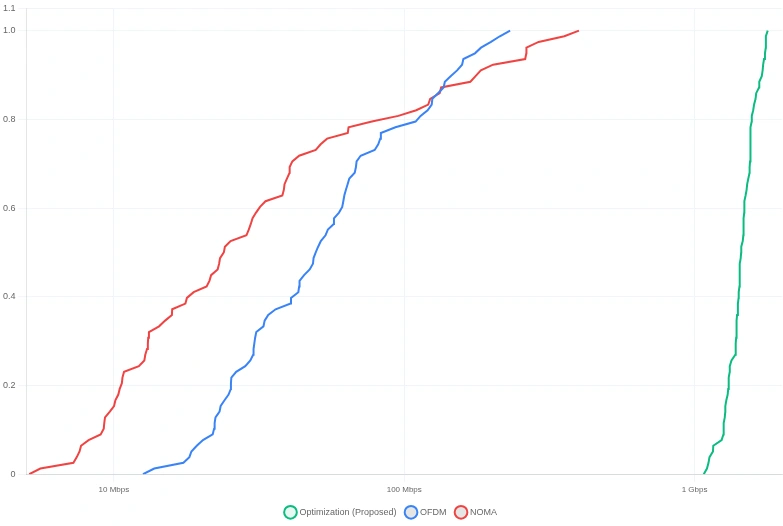
The horizontal axis is total bit rate on a logarithmic scale and the vertical axis is cumulative probability. A curve farther to the right indicates larger bit rates at the same cumulative probability in the evaluated scenarios. The displayed comparison covers optimization, NOMA and OFDM; it does not supply a universal improvement factor or a new conversion to bit/s/Hz.
research presentation, PDF p. 32; Clustering study, Fig. 3, PDF p. 6, and discussion on PDF p. 7. Read source · PDF page 6 ↗ · Related presentation topic →
Read the topology examples as allocation snapshots
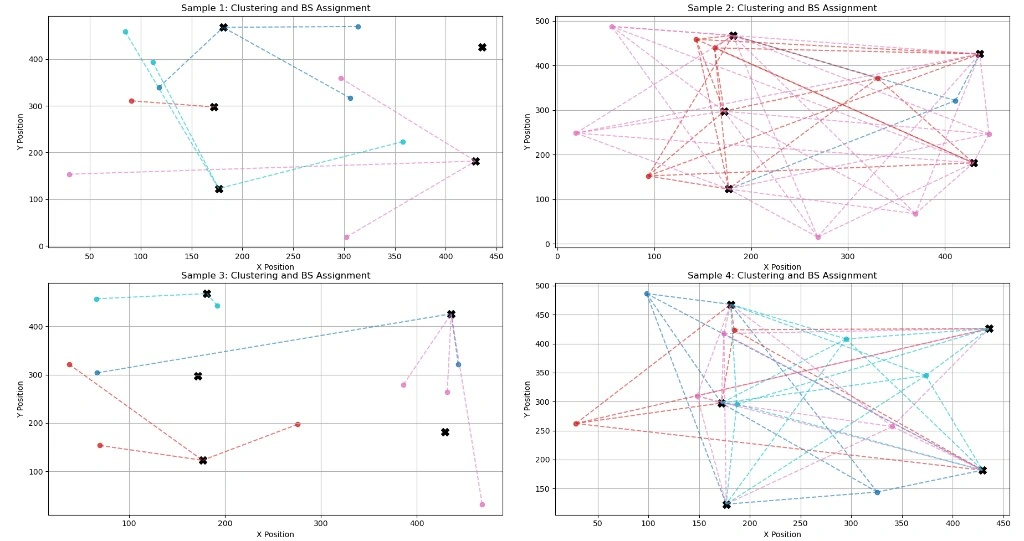
Colored points identify user clusters, black crosses mark base stations and dashed lines show assignments. The four layouts illustrate that the selected serving relationships can change across network instances. They are static examples from the research, not a real-time simulation or proof of adaptation under mobility.
research presentation, PDF p. 34; Clustering study, Fig. 4 and discussion, PDF p. 7. Read source · PDF page 7 ↗ · Related presentation topic →
Keep optimization and inference separate
The presentation's training-versus-inference diagram places the allocation solver in the offline data-generation stage and the learned ensemble in the prediction stage. Its operation-count expression should not be interpreted as a measured device latency or a polynomial-time guarantee for the underlying integer optimization problem.
research presentation, PDF pp. 27 and 35; Clustering study, Section III.A, PDF pp. 7-8. Read source · PDF page 7 ↗ · Related presentation topic →
Further interpretation notes
- The result tables preserve the published values and units. This website does not independently reproduce the experiments or certify the supplied research code.
- Constraint penalties and binary rounding are not feasibility guarantees. A separate check against a clarified, author-reviewed formulation is recommended before operational use.
- Linearizing binary products is exact for those products; approximating the rate term is not exact. Binary decision variables remain, so linearization alone does not establish polynomial-time global optimization.
- The paper and presentation contain conflicting ensemble counts and bandwidth descriptions. No fixed ensemble count, input-feature width, new throughput conversion, or universal speedup is inferred from them.
- The presentation adds a constraint-violation percentage that is not supported by the paper's Table II. It is not included in these reported-result tables.
- The presentation's later LP-relaxation and dual-decomposition slides provide additional discussion. They are not silently substituted for the published CBC-to-ensemble pipeline or presented as a separately validated result.
Cite this article
Pooya Hejazi; Masoud Sabaei. (2026). Optimizing Spectral Efficiency through User Clustering in User-centric Cell-free Massive MIMO Environment for 6G Wireless Network. Journal of Communications and Networks, 28(1), 30–39. https://doi.org/10.23919/JCN.2025.000085
BibTeX
@article{Hejazi2026UserClustering,
  title = {Optimizing Spectral Efficiency through User Clustering in User-centric Cell-free Massive MIMO Environment for 6G Wireless Network},
  author = {Hejazi, Pooya and Sabaei, Masoud},
  journal = {Journal of Communications and Networks},
  year = {2026},
  volume = {28},
  number = {1},
  pages = {30--39},
  doi = {10.23919/JCN.2025.000085},
  url = {https://doi.org/10.23919/JCN.2025.000085}
}Download BibTeX · Download RIS
Article © its authors. CC BY-NC 3.0. Original PDF and rights notices preserved.